
THE BIGGER THE DATA
THE STRONGER THE STORY
How To Use Data To Deliver A More Personal and Powerful Customer Experience
Everything we do becomes data. Every site we visit. Every shopping cart we abandon. Every tweet we read. It all becomes part of this massive collection of interwoven data that gets stored in a data warehouse and begins to define us. In the right hands, it can be used to create personalized marketing stories that connect with customers and drive results. In the wrong hands, it can become at best, an annoyance and at worst, an invasion of privacy.
Worldmedia Interactive will show you the five steps of turning all your customer data into a truly powerful marketing story. You’ll see how we collect, combine, visualize, analyze and activate all of the data and create true custom experiences from it.
VOLUME
Big Data is just that, BIG. In order for data to move up into the Big Data category, it has to have so much volume that it can’t fit into a single spreadsheet. With all of the devices, all of our connections and all of our actions, a single person’s data can start to fill that sheet pretty fast on its own. And according to a study conducted by Gartner, there will be 21 Billion Internet of Things (IoT) connected online by 2020. That can balloon the data just from those devices to more than a petabyte. Curious how much data that really is? Wes Biggs, CTO of Adfonic breaks it down like this: If the average smartphone camera photo is 3MB in size and the average printed photo is 8.5 inches wide, then the assembled petabyte of photos placed side by side would be over 48,000 miles long – almost long enough to wrap around the equator twice.
VARIETY
Data is no longer single source. It comes from everywhere. Social Media, Smartphones, Smarthomes, Email, Site-side, In-store; if you touch it, taste it, look at it or even think about it, chances are it’s being measured. While the past was all about determining metrics per medium, now it’s seeing patterns across all actions. This is more than just marketing, it’s actual science. IBM has teamed data scientists with public health scientists to analyze the transactional retail scanner data of grocery stores to quickly determine the cause of food-born illness outbreaks. In the study, researchers demonstrated that with as few as 10 medical-examination reports of foodborne illness, they can narrow down the investigation to 12 suspected food products in just a few hours. This used to take days, even weeks to accomplish.
VELOCITY
This is about the speed that data comes in. In the not too distant past, we were measuring things weekly, or maybe even daily, if we were looking at sales. Now, data can be measured in microseconds. The move of a mouse, the tracking of the eye, the time to tweet, it all comes in lighting fast. A single trade on the NYSE has more than 1 TB of information that is passed through. EVERY SECOND there are 738 photos posted to Instagram, 2.5 million emails sent and 37,378 GB of internet traffic. And we need to capture and measure it all. That takes more than just expertise. It takes processing power.
5 STEPS TO GO FROM DATA TO DELIVERING ACTION
Now that we know what Big Data is, how do we use it? Follow these 5 steps to go from data to delivering action.
1. THE COLLECTION OF DATA
Collect data from everywhere. EVERYWHERE.
Think of data like the ingredients for a meal. The fresher it is, the better your meal will taste. And just like some meals require you to go to different stores to get the best ingredients, the same goes with data. You need to plug into social sites to gain valuable metrics based on interest. Many of these sites will provide APIs that you can tap right into. Media sites will allow you to learn about action and attribution when used in conjunction with an Ad Server such as Double Click. Your own website will show you behaviors that can’t be found anywhere else. And let’s not forget purchase data. Or demographic data. Or mobile data. You get the picture.
We need to get as much data from as many sources as possible in order to make the perfect marketing meal. Of course, you need to put all that data somewhere – and that’s usually a data warehouse. Today, that usually happens in the cloud, where you have multiple high-powered processors able to ensure not a drop of data is spilled. Here’s where it gets really tricky, even after the data is stored, you need to have a big enough bowl to mix all of these different pieces of data together.

2. THE COMBINATION OF DATA
One big happy family. Like The Brady Bunch of information.
So if data is too big for a spreadsheet, too varied to form common columns and too frequent for weekly reports, how do you get it all together? Add to the equation that 80% of all data is unstructured and it’s no wonder so many marketers are left scratching their heads.
The most common and popular way to store Big Data is Apache Hadoop. It’s an open source system made to run on low-cost hardware and expand quickly when needed. The beauty of Hadoop is that it’s a software ecosystem that can store any type of data, from structured (think sales numbers) to unstructured (like photos and videos.) Since Hadoop isn’t technically a database, the system can be complicated and thus, new easier-to-use competitors have been making waves lately. Splunk is more of an out-of-the box application that requires far less specialized developer and administration skills.
Right behind Hadoop is NoSQL (Not Only SQL), which actually can be paired with Hadoop to an extent, and powers some of the biggest data warehouses around, like Google, Amazon, and the CIA. Cassandra is also another open source Apache distributed database. As you can see, the list of options is plentiful and like Big Data itself, is growing by the moment. All of these databases can store your Big Data and tie into analytic software to help make something of it. The right one for you will be based on your preference of visualization and analytic tools available, and of course, which one your developer is most comfortable with.
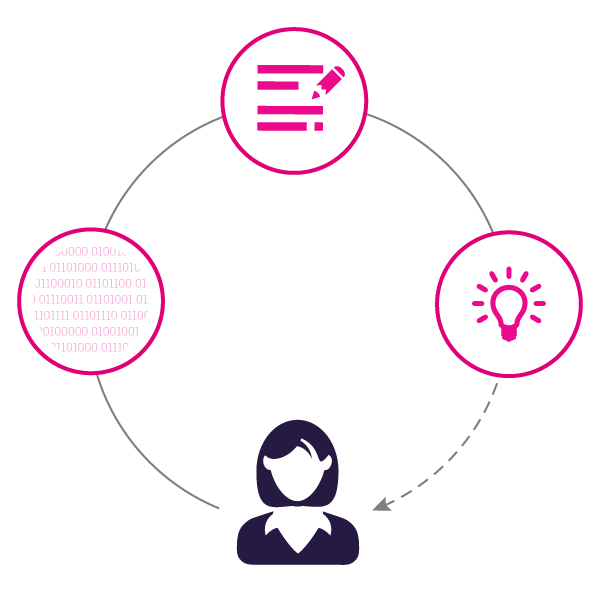
3. THE ANALYSIS OF DATA
There’s gold in them there charts. You just have to mine it.
This is the most critical, yet most often overlooked part of Big Data. Many marketers confuse the ability to record data with the ability to analyze data and that can leave your insights DOA. It takes a keen eye to spot insights, especially ones that can be turned actionable. That’s where analysts come in.
While a data scientist can help spot that needle in a haystack when it comes to data insights, a business analyst can tell you how that needle got there and why it matters. They turn seemingly unrelated trends into one powerful strategy. It’s all about seeking similarities. Maybe it’s connecting the amount of favorite brand tweets to the lift in bookings, or that smokers are more likely to click on ads that feature rooms with open windows. These little nuggets can become meaningful marketing briefs if one knows where to look. Red Roof was able to pinpoint the airports with the highest crossover between flight cancellations and same-day bookings at their hotels. They developed a bad weather marketing initiative based on these locations and have seen 10% in growth, year-over-year.
While each business has different KPIs, here’s a quick cheat sheet on what to look for:
ATTRIBUTION MODELING
This determines the true path to a sale and gives you a glimpse into how your media plan amplifies and impacts purchase. It’s no longer about the last click or the walk into the store; it’s all about the overall journey.
EFFECT OF INFLUENCERS
This will show you how others affect your customers’ purchase decisions, both positively and negatively. This, coupled with your own media and content, will give you a true 360 view of purchases.
BRAND LOYALTY
Being able to spot potential drop-offs before they occur will ensure your revenue stays high. Purchase patterns coupled with search and social behavior can unlock some clues as to whether a customer will stay or be stolen away.
4. THE VISUALIZATION OF DATA
Do you see what I see? You will.
So you’ve built a database and have all your data filling it to the brim. How do you get it out and not have it look like millions of 0’s and 1’s? The simple answer is that you use a data visualization tool. The complicated answer is that you use many of them.
Say you want to see the geographical location of your top customers, overlaid with your most popular items. That will need to look much different than if you want to see a timeline of purchase behaviors for a particular demographic. The key is to plan the type of info that can power your decision making and use a tool to bring that to life. How tech and development savvy your team is will also help guide you.
If you’re looking for some plug and play options that can chart out a variety of Business Intelligence Data, there are several major players in the market. DOMO is a great tool that connects the dots from just about any data source. Tableau has been on the rise the last several years, known for its ability to quickly translate large amounts of data. Other players are SAP, IBM and even Dell.
The best options however, are usually custom. They use different components to create different types of dashboards and visuals. This ensures that you get exactly the information you need in the best way for you to analyze it. Your technology team can build it using a combination of plotting tools, chart tools (even Google makes one) and APIs to feed the data. This can get very complicated, but then again, so is looking at raw data.
5. THE ACTION OF DATA
Ready. Aim. Fire. The ultimate weapon in marketing.
Consumers are savvier than ever. They’ve turned ignoring advertising into an art form. If they don’t block your ad, they’ll just pretend it’s not there. But what if we could predict a time, a message and a platform that they would be willing to listen to? What if we could move from selling, to telling and be invited in? That’s what Big Data does.
Once you’re armed with insights, you can create personalized, relevant, content-driven experiences. Say you know that a particular customer has a dog. He posts pictures of his dog, brags about his dog, maybe even enters dog shows. His dog even has a Twitter handle. Rather than market your property about being dog-friendly, you can create a personalized campaign FOR the dog. Develop content about the top dog parks in America. And ask for submissions to the best pets on the road photo challenge. You’ve now pulled him in with content that resonates instead of pushed him an ad just about yourself — which could push him away.
It’s not just about your message; data can be the driver of your product as well. Netflix and Amazon make recommendations based on not just what you watch or buy, but also on how you behave on their sites, and develop programming based on those behaviors. Delta built an app that lets you track your luggage all the way through final destination based on the data they collected through customer service agents. Uber even introduced Uber Pool based the numerous similar travel patterns of its users.
Then there’s predictive analysis, the ability to determine what someone wants to purchase before they know it themselves. Imagine selling a cruise the exact moment someone is dreaming about it. Or knowing that a mother needs to buy new shoes for her daughter because the average growth cycle is 3 months and it’s already been 11 weeks since her last pair. Our advertisements become less of an invasion and more of a utility.
Big Data takes the guesswork out of messaging, positioning and timing. It allows you to make your ads more than just annoyances, but a meaningful connection between your brand and your customer.